- Phylum
- Cyanobacteriophyta
- Class
- Cyanophyceae
- Order
- Chroococcales
- Habitat
- planktonic
- Distinctive features
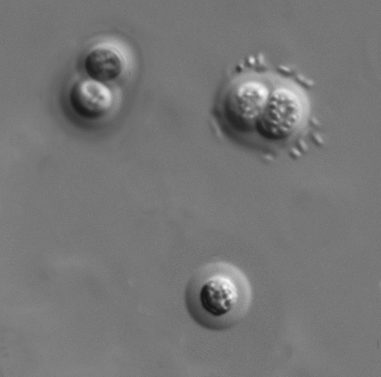
- single spherical cells or couples of hemispherical cells after cell division, surrounded by a wide colorless homogeneous .
- Organization
- single cells or colonies of 2 (most common) to 8 cells
- Color
- blue-green
- Cell shape
- sphere
- Colony shape
- spherical
- Cell diameter (D)
- 3 – 10 μm, median: 5.9 μm (N=1500). Cell diameter varies significantly over an annual cycle, making it necessary to measure it routinely.
- Cell biovolume
- 20 – 500 μm3, median: 110 μm3. Larger cell size in winter, smaller in summer (see Fig. 2).
- Biovolume equation
- Sphere V, μm3 = 4/3 π (D/2)3.
Morphological features
Individual spherical blue-green colored cells are surrounded by a wide colorless homogeneous sheath (Plate 1). The species is polymorphic with numerous morpho-and ecotypes. Chroococcus turgidus and Chroococcus minutus are difficult to tell apart. The most notable difference is that the sheath of C. minutus is usually homogeneous with no layering while that of C. turgidus is laminated (layered). Furthermore, on average C. minutus cells are smaller, but both species show large size variation and the sizes overlap.
Ecology
An alanlyst effect is apparent in the long-term record of C. minutus and C. turgidus shown in Fig. 1. In particular, it is evident that Analyst 5 (1996-2012) counted more C. minutus whereas Analyst 6 (2013-2020) counted more C. turgidus, probably due to different taxon names given to the same organisms. Chroococcus minutus / turgidus has always been common in lake Kinneret, with long periods of thousands of (mostly 2-celled) colonies mL-1 (Fig. 1). Prior to the decline of Peridinium gatunense and appearance of nostocalean cyanobacteria in the mid 1990s Chroococcus was the most abundant Kinneret cyanobacterial taxon. Peak abundance is from August to October (Fig. 2). Like several other Kinneret species, cells are smaller in summer, larger in winter (Fig. 2).
Environmental conditions
Advantaged by high water temperatures (>25°C) and a well-stratified water column. Indifferent to chloride concentrations.
Cite this record as: Dr. Tamar Zohary, Dr. Alla Alster. 7 August 2026. Electronic publication. Israel Oceanographic & Limnological Research. https://kinneret-algae-atlas.org/ Searched on —.